
Fault Tree Analysis (FTA) Guide: Process, Symbols & Examples
With over two decades in business – spanning strategy consulting, tech startups and executive leadership – I am committed to helping your organization thrive.
At Reliability, we’re on a mission to help enhance strategic decision-making and operational excellence through the power of Root Cause Analysis, and I hope this article will be helpful!
Our goal is to help you better understand Fault Tree Analysis (FTA) by offering insights and practical tips based on years of experience. Whether you’re new to doing root cause analysis or a seasoned pro, we trust this will be useful in your journey towards working hard and working smart.
_________________
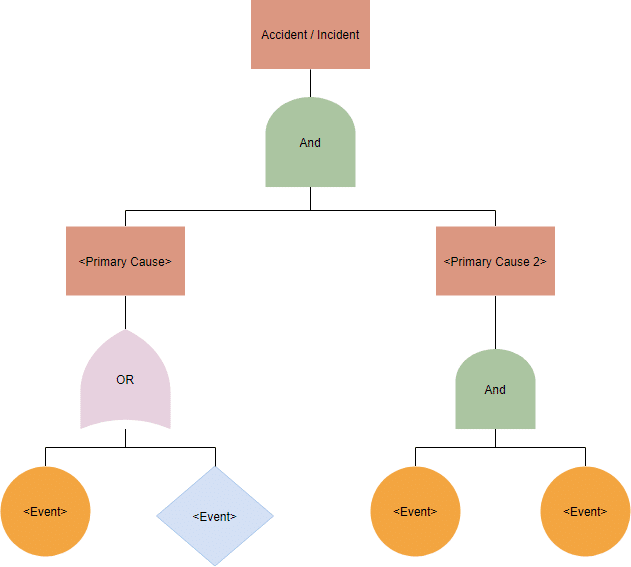
Fault Tree Analysis (FTA) may sound intricate but think of it as unraveling a ball of wool. Picture the ball of wool as the problematic event in your system, and each strand you unravel as a potential contributing cause. Now, imagine if each strand was organized systematically, representing the hierarchy of contributing factors and their interconnections. That, in essence, is Fault Tree Analysis. A graphical, deductive failure analysis tool, FTA investigates complex systems and identifies the pathways within them that can lead to undesirable outcomes.
The inception of Fault Tree Analysis dates back to the mid-20th century, a time when the US was launching its first nuclear missiles and looking to mitigate their failure risks. The aerospace company Bell Laboratories and the U.S. Air Force initially developed the FTA in 1961 as a means to evaluate the Minuteman I Intercontinental Ballistic Missile (ICBM) Launch Control System Safety. Since then, FTA has become a versatile tool applied across diverse fields, including chemical, nuclear, aviation, software, and healthcare industries.
Decoding the FTA Process
Creating an FTA diagram is akin to piecing together a jigsaw puzzle. Each piece plays its role, connecting to others in a systematic way to complete the picture. The steps to construct a Fault Tree are as follows:
| Steps | Description |
| 1. Identify the undesired event | This event is placed at the root (top) of the tree and is typically a system level failure. |
| 2. Determine the immediate causes | These are placed below the root, branching out like the limbs of a tree. |
| 3. Decipher the contributing factors | Analyze each branch to identify further contributing causes until all potential factors have been identified. |
| 4. Create the Fault Tree diagram | The tree grows downwards, with branches representing different potential causal chains. |
What are fault tree analysis symbols?
There are two basic types of fault tree diagram notations: Events Symbols, Gates Symbols and Transfer Symbols. The primary or basic failure event is usually denoted with a circle. An external event is usually depicted with a symbol that looks like a house.
Event Symbols:
| Symbol Number | Event Symbol | Description |
| 1 | 
| Basic Event (Circle): This is an elementary or basic fault that occurs at the lowest level of the tree. Basic events are the root causes of the failure being analyzed, and cannot be further divided into other events. |
| 2 | 
| Intermediate Event (Rectangle): These represent combinations of lower-level events. An intermediate event typically occurs due to two or more basic events. |
| 3 | 
| Undeveloped Event (Diamond): An undeveloped event is a basic event for which no further information is available or for which no further details are needed. This event is not further expanded. |
| 4 | 
| Conditional Event: An event that is associated with occurrence of some other events. |
| 5 | 
| House Event: A House Event symbol is typically used to represent a “safe state.” This state is achieved when the necessary conditions are fulfilled to prevent a top-level event from occurring. |
Gate Symbols:
| Symbol Number | Event Symbol | Description |
| 1 | 
| AND Gate (Curved ‘T’): This gate indicates that all input events must occur for the output event to occur. If there are three inputs to an AND gate, all three must occur for the event above the gate to happen. |
| 2 | 
| OR Gate (Flat ‘T’): An OR gate represents that any of the input events can lead to the output event. If there are three inputs to an OR gate, any one, two, or all three can trigger the event above the gate. |
| 3 | 
| Priority AND Gate: This gate indicates that all input events must occur in order, from left to right, for the output event to occur. |
| 4 | 
| Exclusive OR Gate: This gate indicates that either of the two input events, but not both, must occur for the output event to occur. |
Transfer Symbols:
| Symbol Number | Event Symbol | Description |
| 1 | 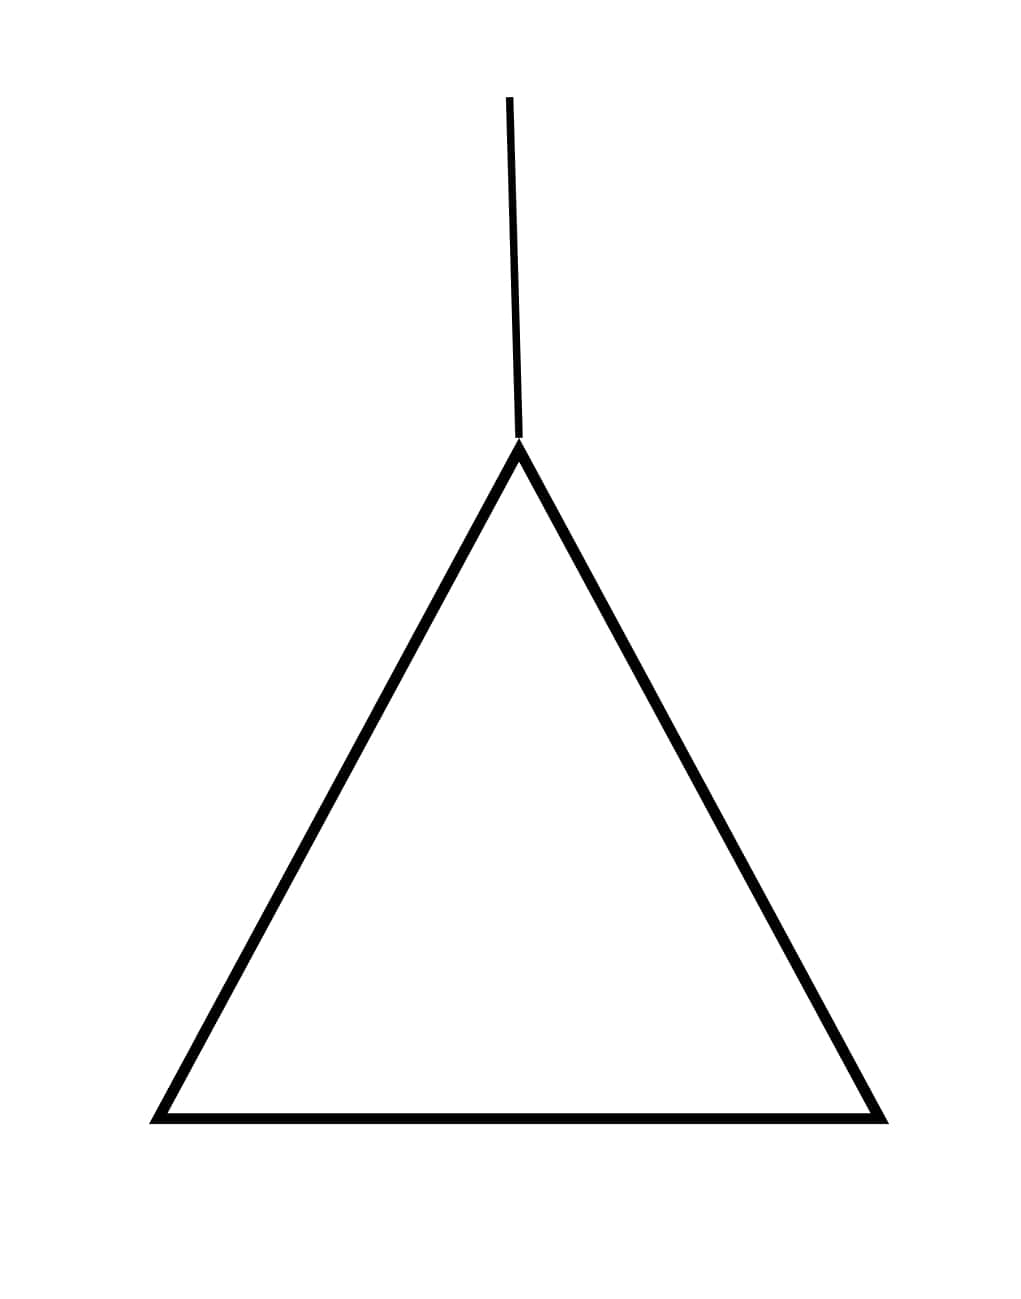
| Transfer In (Triangle Pointing Right): This symbol indicates that the event is developed elsewhere in the fault tree. |
| 2 | 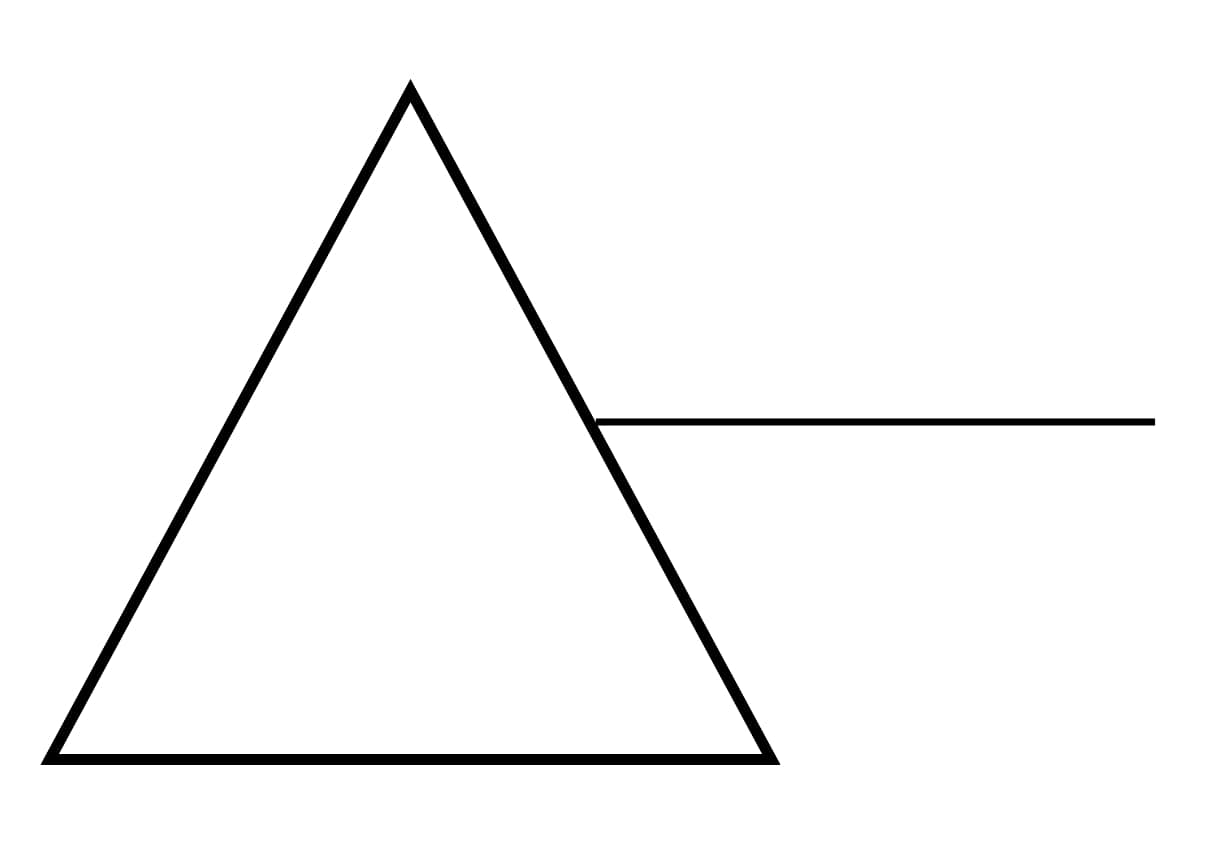
| Transfer Out (Triangle Pointing Left): This is used when a section of the fault tree is repeated elsewhere in the tree. The transfer out symbol marks where the section ends. |
These symbols, when used together in a fault tree diagram, can illustrate the interconnections between various events and potential faults in a system, providing a clear visual representation of complex failure scenarios.
Advantages of using Fault Tree Analysis (FTA)
1. Comprehensive Problem Visualization
- The structured, tree-like representation in a FTA helps in visualizing complex problems in an easy-to-understand manner. This graphical representation allows teams to identify multiple failure scenarios and how they are linked, making it simpler to grasp the full breadth and depth of a potential issue.
2. Identification of Root Causes
- FTA excels in pinpointing the root causes of system failures. The deductive approach of the method facilitates a deep dive into issues, encouraging a systematic exploration of how lower-level events contribute to higher-level failures.
3. Risk Prioritization
- FTA helps in risk prioritization by quantifying the probability of different faults. This feature supports effective resource allocation to address the most critical risks, maximizing the impact of mitigation efforts.
4. Promotes Proactive Approach
- FTA encourages a proactive attitude towards problem-solving. Instead of waiting for failures to occur, teams can identify potential problem areas and put measures in place to prevent their occurrence.
5. Improves System Design
- The insights derived from an FTA can feed into the design of new systems. Understanding how failures occur and their repercussions can inspire improved system design with built-in mitigation strategies.
6. Enhances Communication
- The visual nature of FTA promotes clearer communication among diverse team members. The tree diagram serves as a common language, ensuring everyone understands the potential issues and proposed solutions.
By embracing FTA, organizations can bolster their risk management strategies and foster a culture of continuous improvement. This way, they’re not just reacting to issues as they arise, but anticipating potential problems and mitigating them in advance. This proactive approach leads to safer, more efficient operations.
Types of Fault Tree Analysis
1. Quantitative Fault Tree Analysis
- This type of FTA applies statistical data to determine the probability of the top event (system failure) occurring. It uses failure rates and event probabilities to compute the probability of the undesired event. For systems where historical failure data is available, a Quantitative Fault Tree Analysis can be a highly valuable tool to predict future system behavior. This can inform strategies for preventative maintenance, system redesign, or procedures that mitigate risk.
2. Qualitative Fault Tree Analysis
- The Qualitative FTA method is used to identify the sequence of events that lead to a system failure. It does not focus on the mathematical probabilities of failure but rather on the relationships between failures. This approach is useful when statistical data is scarce or when the goal is to understand the possible combinations of events that can lead to system failure. It can offer valuable insights into which subsystems or failure events warrant the most attention in terms of system safety or reliability improvement.
3. Boolean Logic Driven FTA
- This variant leverages Boolean algebra to evaluate the Fault Tree. It is particularly useful in dealing with complex systems with a multitude of interconnected components. By constructing a truth table and applying the rules of Boolean algebra, the analyst can compute the probability of the top-level failure from the probabilities of the basic events. This approach simplifies even highly complex FTAs and enhances their value as visual aids.
4. Fuzzy Fault Tree Analysis (FFTA)
- FFTA is a more recent development that applies fuzzy logic principles to the fault tree analysis. This method is effective when the inputs or failure probabilities are vague or imprecise, which can often be the case in real-world systems. By allowing for degrees of truth (i.e., failure probabilities that are not just 0 or 1, but can take any value between), FFTA brings a greater level of nuance to fault analysis.
When to use Fault Tree Analysis
Fault Tree Analysis comes into play when there’s a mystery to be solved. It’s most effective when used to analyze complex systems, investigate major failures, or assess new processes or designs for potential issues.
Fault Tree Analysis, with its broad-ranging applications and insightful results, stands as an invaluable pillar in the world of system reliability and risk management. As a complex tool, it requires consistent practice and exploration to truly unlock its full potential.
Reliability is dedicated to being your companion in this journey. Our platform is a rich reservoir of knowledge, offering expert guidance, comprehensive resources, and a thriving community of professionals. We believe in continuous learning and exchange of ideas, leading to innovation and enhanced efficiency.
________________
`I hope you found this guide to Fault Tree Analysis insightful and actionable! Stay tuned for more thought-provoking articles as we continue to share our knowledge. Success is rooted in a thorough understanding and consistent application, and we hope this article was a step in unlocking the full potential of Root Cause Analysis for your organization. If Fault Tree Analysis isn’t the type of analysis you were looking for, feel free to explore these 7 root cause analysis methods and tools that you can apply to resolve more complexed issues.
Reliability runs initiatives such as an online learning center focused on the proprietary PROACT® RCA methodology and EasyRCA.com software. For additional resources, visit Reliability Resources.
Recent Posts
AI and Site Reliability Engineers: Lessons from the Field.
Smarter, Faster, Deeper: How AI Is Transforming Root Cause Analysis in Software and Beyond
North America’s Looming Power Shortfall: A Root Cause Analysis for the Grid—and Beyond
Preventing EV Charger Downtime: How Smart Test Strategies Act as Root Cause Analysis in Action
Root Cause Analysis Software
Our RCA software mobilizes your team to complete standardized RCA’s while giving you the enterprise-wide data you need to increase asset performance and keep your team safe.
Root Cause Analysis Training

