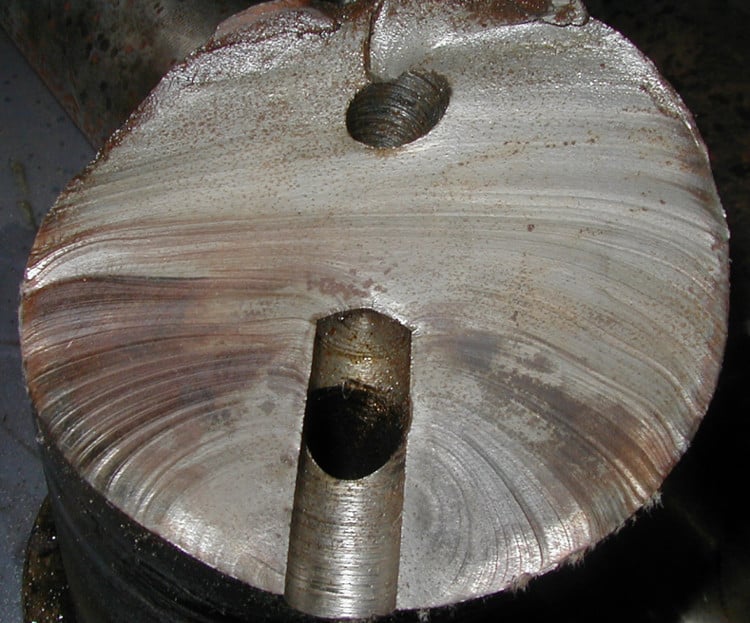
Can you identify and name this fracture pattern?
How can you tell it is that fracture pattern?
Where are the origin(s) of the failure on the fractured surface?
How can you tell where the origin(s) are?
As usual, we will use the collective experience and expertise of our viewers to educate each other, and to increase awareness to the extensive value of preserving failed parts and to the amazing skills of metallurgists!
We will post the answers to these questions in a week or so, but I suspect the input we will get from our metallurgical friends will provide all the answers we need:-)
FOLLOW UP POST 6.5.17 (Provided by Mark Latino, Sr. Investigator, RCI)
Thanks for the excellent responses from our obviously seasoned, metallurgical veterans. Given the limited information everyone was provided, they had to make a preliminary call based only on the evidence of the fracture surface. The consensus was spot on. Thanks for your willingness to share your expertise to those who may see failed parts all the time, but not know how to read the surfaces. This gives them a whole new appreciation for the value of saving failed parts.
The nutshell answer: High cycle fatigue due to rotational bending.
How does one know this? For those who are not metallurgists or materials engineers, we’ll go over the basics. The origins of the fracture can be traced back to where the progression marks started. Some people call them ‘progression marks’, ‘beach marks’ or ‘clam shell marks’, but they are all the same thing.
As the high cycle fatigue continues and the progression marks become larger and larger, the final fracture zone (also call instantaneous zone) can no longer absorb the load and fails in an overload pattern.
The size of the final fracture zone (vertical blue lines) determines the degree of loading at the time of the failure. A larger final fracture zone indicates a high load was present. Conversely, a smaller final fracture zone indicates a light load present at the time.
Clarification note from expert Neville Sachs (who provided the picture above with permission): Progression marks show changes in loading. Let’s assume there is continuous cyclical loading on a piece failing from fatigue. When the range of that cyclical loading is high, there will be relatively rapid crack propagation. Then the loading, although still cyclical, drops in magnitude. At that point, i.e., the load dropping in magnitude, a progression mark forms because of the relaxed crack tip plastic stress. The benefit of this is that we can look at progression marks and identify specific events in the life of the failure, thereby helping to understand the time to final failure.
How did our experts know there was rotational bending? In this case, the progression mark patterns went in a counterclockwise direction. The final fracture zone was located at the opposite side of the origin, indicating rotational bending.
While these basic explanations are ‘Metallurgy 101’ to our experts who have kindly participated, it is to all of our advantage to educate those on the front lines who often are the first to see such failed parts. This is because if they understand how important preserving such parts are to an investigation, they are more likely to do so. Better yet, if they have a basic understanding of how to read fractured surfaces, they will become a part of the investigative process by trying to make their own ‘call’ on what caused the physics of the failure. Then they will want to participate just because of their own curiosity and that is a win all the way around:-) Thanks everyone for making these blogs fun to participate in, as well as educational.
Please click the hyperlink if you’re interested in more job aides likes this and/or information on associated training and tools to help with understanding Why Parts Fail.
About the Author
Robert (Bob) J. Latino is former CEO of Reliability Center, Inc. a company that helps teams and companies do RCAs with excellence. Bob has been facilitating RCA and FMEA analyses with his clientele around the world for over 35 years and has taught over 10,000 students in the PROACT® methodology.
Bob is co-author of numerous articles and has led seminars and workshops on FMEA, Opportunity Analysis and RCA, as well as co-designer of the award winning PROACT® Investigation Management Software solution. He has authored or co-authored six (6) books related to RCA and Reliability in both manufacturing and in healthcare and is a frequent speaker on the topic at domestic and international trade conferences.
Bob has applied the PROACT® methodology to a diverse set of problems and industries, including a published paper in the field of Counter Terrorism entitled, “The Application of PROACT® RCA to Terrorism/Counter Terrorism Related Events.”
Recent Posts
How to Improve Your RCA Program: A Practical Guide for Reliability Leaders
The 2026 Reliability Cost Curve: How World-Class Teams Bend It Downward
The Reliability Leader’s 2026 RCA Playbook: A Straightforward Guide to Starting the Year Strong
Why You Never Have Time for Root Cause Analysis (And How World-Class Teams Fix It)
Tags
PROACT® software
rca investigations
Reliability
reliability concepts
reliability culture
return on investment
roi
root cause analysis
Training for RCA
Root Cause Analysis Software
Our RCA software mobilizes your team to complete standardized RCA’s while giving you the enterprise-wide data you need to increase asset performance and keep your team safe.
Root Cause Analysis Training


